TRACS Shipping Activity Overview
Below we show some of the seaborne trade and shipping demand data extracted from TRACS – Oceanic’s proprietary vessel tracking system.
Some of the interesting points to note are:
Shipping demand in terms of the tonnage exported is only marginally above the pre-Covid-19 levels - (Chart 1 below).
Shipping demand in tonne-mile terms has been strong for several years due to geopolitical disruption since the Russian attempted invasion of Ukraine in 2022 and subsequent Middle East conflicts. Strong demand for Atlantic basin commodities from Asia and Chinese manufactured goods from Europe and America has also led to a lengthening of trade routes - (charts 2, 3).
Cargo in transit is also continuing to show strong growth - (Chart 4).
The steaming speed has gone up due to the partial closure of the Suez Canal in Dec 2023, and more recently the Iran conflict – both of which have caused many ships to re-route. This has offset the long term trend for the fleet to slow down to reduce fuel consumption and emissions - (Chart 5).
The port congestion experienced in the aftermath of Covid-19 has normalised and improved the fleet efficiency - (Chart 6).
After suffering drought conditions in 2023, the weather in Panama has normalised, improving throughput through the Panama Canal which had been curtailed during 2023 and 2024 – forcing ships to sail round Cape Horn or Cape of Good Hope - (Chart 7).
The traffic passing through the Suez Canal has shown few signs of recovery due to continued threat of Houthi attacks - forcing more traffic to go round the Cape of Good Hope - (Chart 8).
Oil exports through the Strait of Hormuz collapsed with the Iran war, there has been some compensation by a reduction in the oil at sea, an increase in Us and South American exports and a large reduction in Chinese imports – (Charts 9)
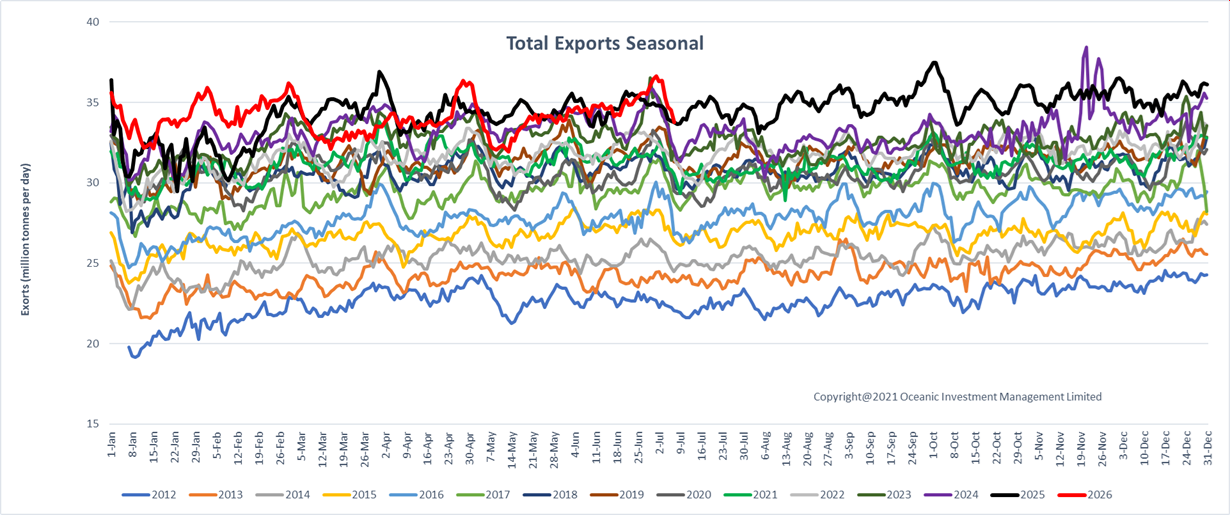
Chart 1
This shows the total tonnage of cargo exported and imported which is a measure of demand for cargo to be shipped.
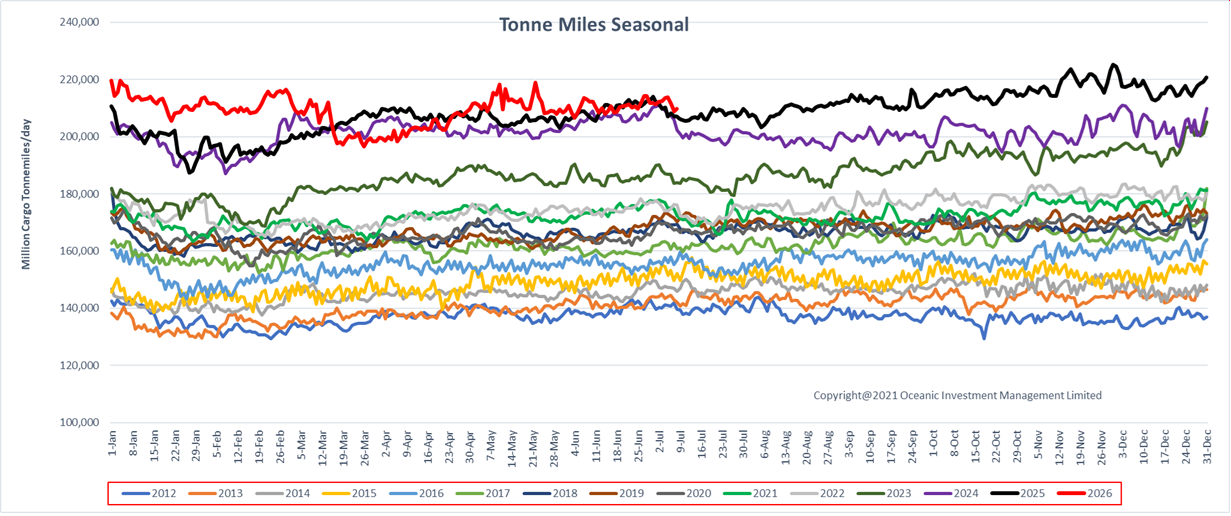
Chart 2
Tonne Miles is the total tonnage of cargo being carried multiplied by the distance the vessels travel daily. This is a measure of the “true “demand for shipping services incorporating the amount of cargo along with the distance the cargo is carried.
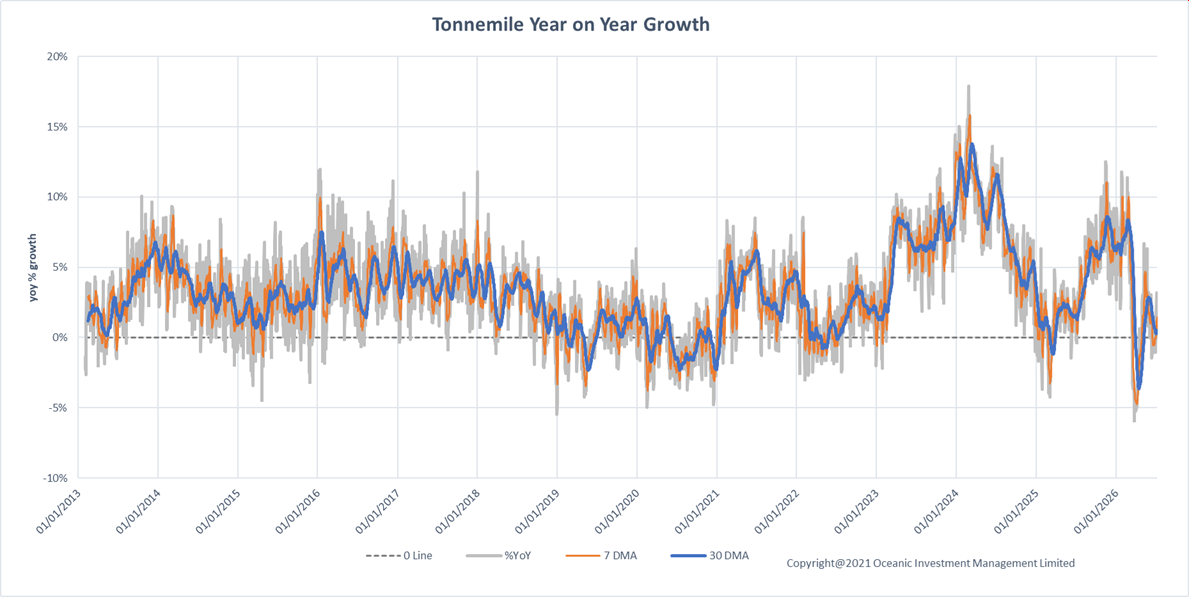
Chart 3
This chart shows the tonne mile data as a % growth year on year, a methodology that removes the majority of the seasonality from the data.
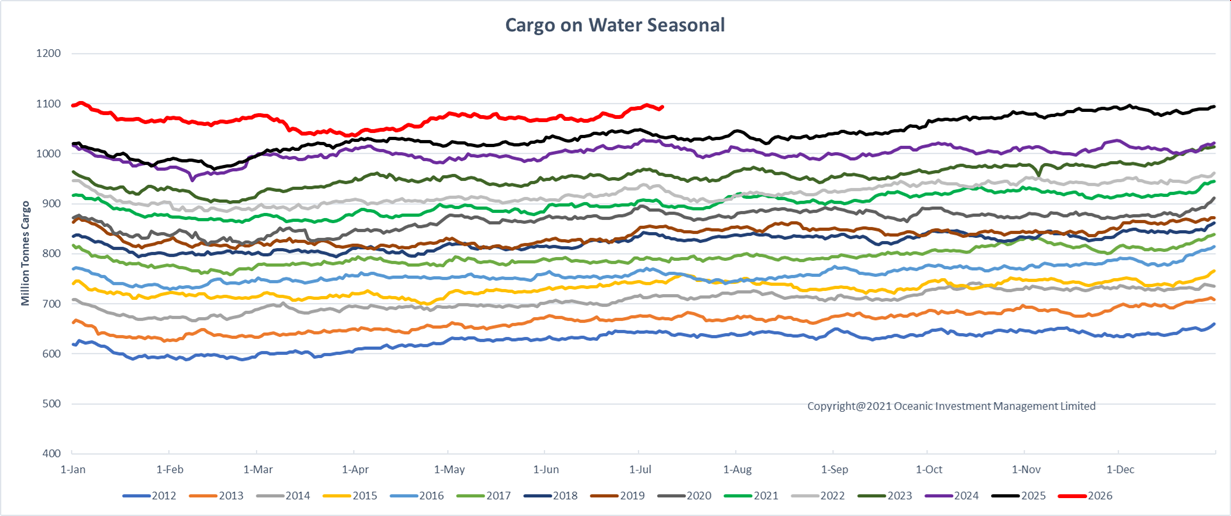
Chart 4
This chart shows the total daily amount of all cargo types loaded aboard the global fleet at any moment in time. Cargo includes crude oil and products, dry bulk, containers, LNG, LPG, vehicles and chemicals. This metric of shipping demand incorporates delays due to port congestion and slow steaming of the fleet as well as floating storage.
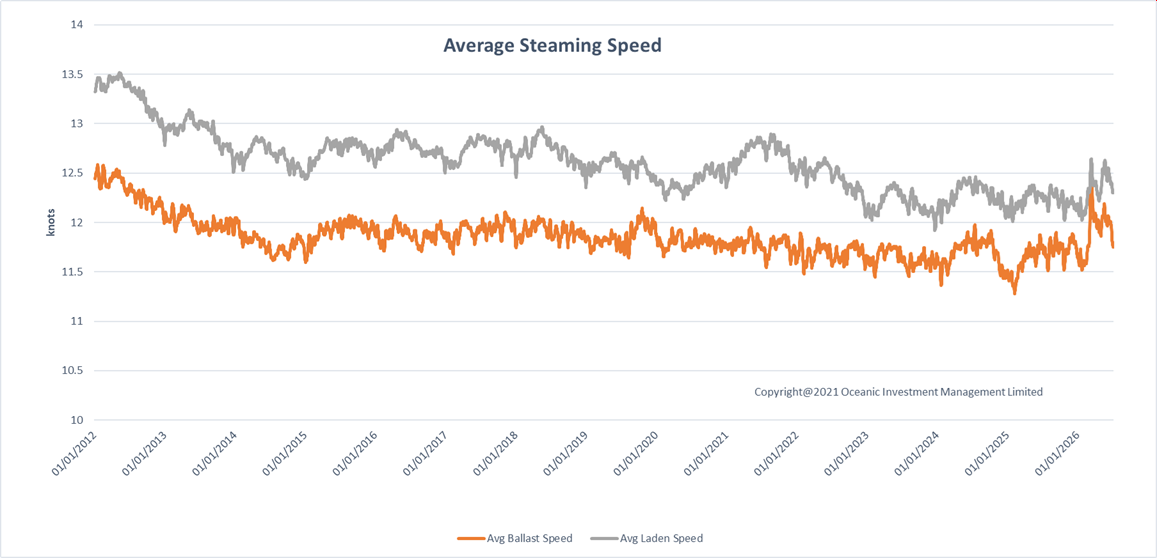
Chart 5
The average speed of the fleet is another metric we follow; this chart shows average speed of world's seagoing fleet measured in knots. Note the pick up in speed experienced due to the Houthi attacks on Red Sea in 2023 – 2024 and the Iran war in 2026.
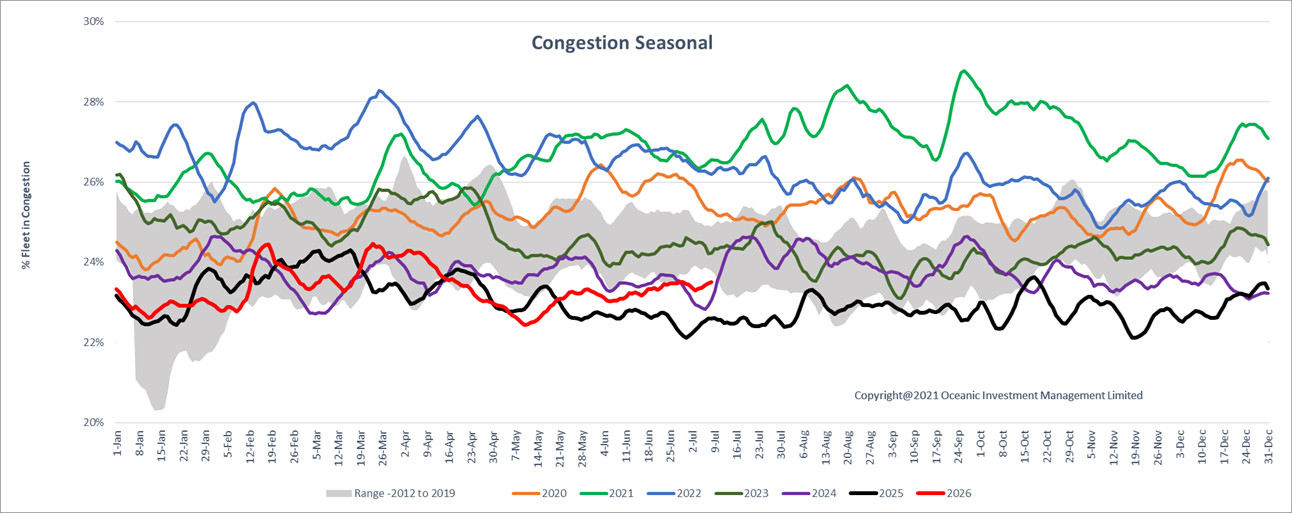
Chart 6
Since 2022, the congestion associated with Covid has unwound - making the fleet more efficient and able to absorb the additional demand.
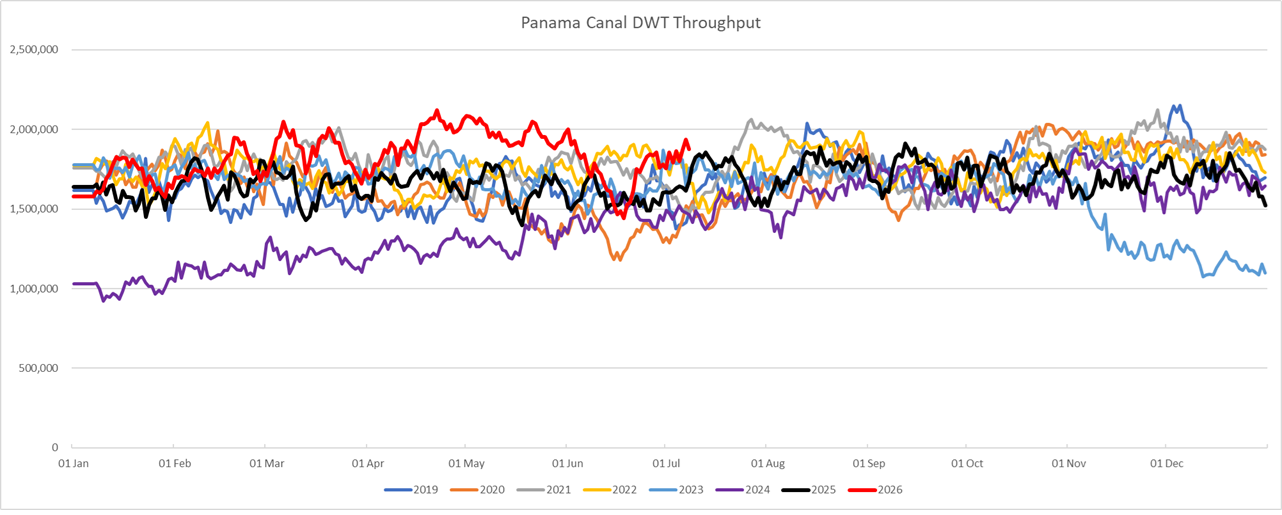
Chart 7
The Panama Canal suffered drought conditions in 2023 and early 2024.
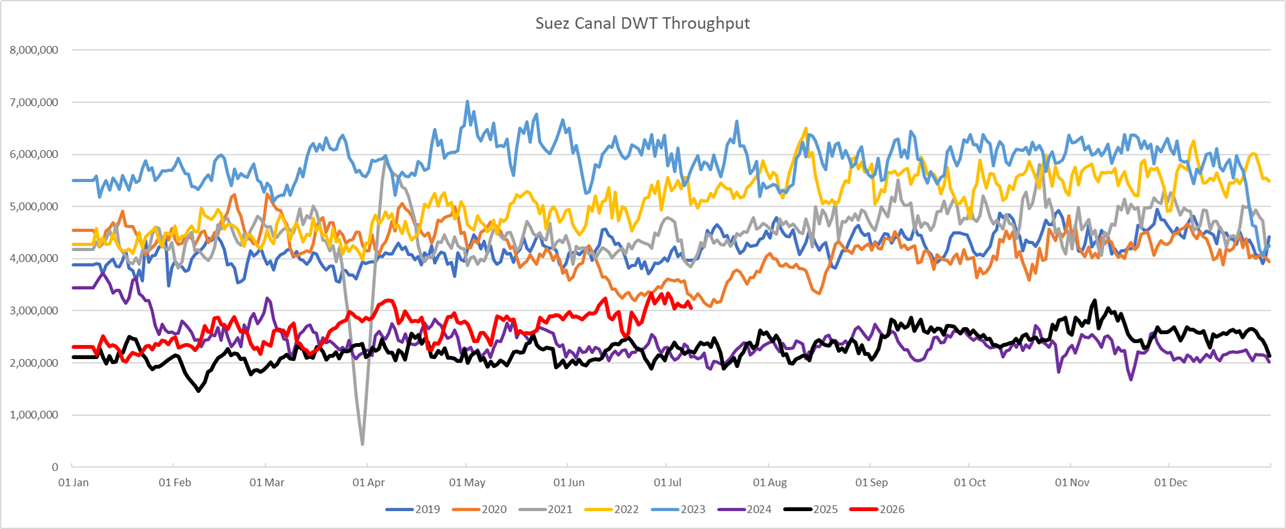
Chart 8
The Houthi attacks on shipping have forced much of the Suez Canal traffic to go round the Cape of Good Hope since the end of 2023.
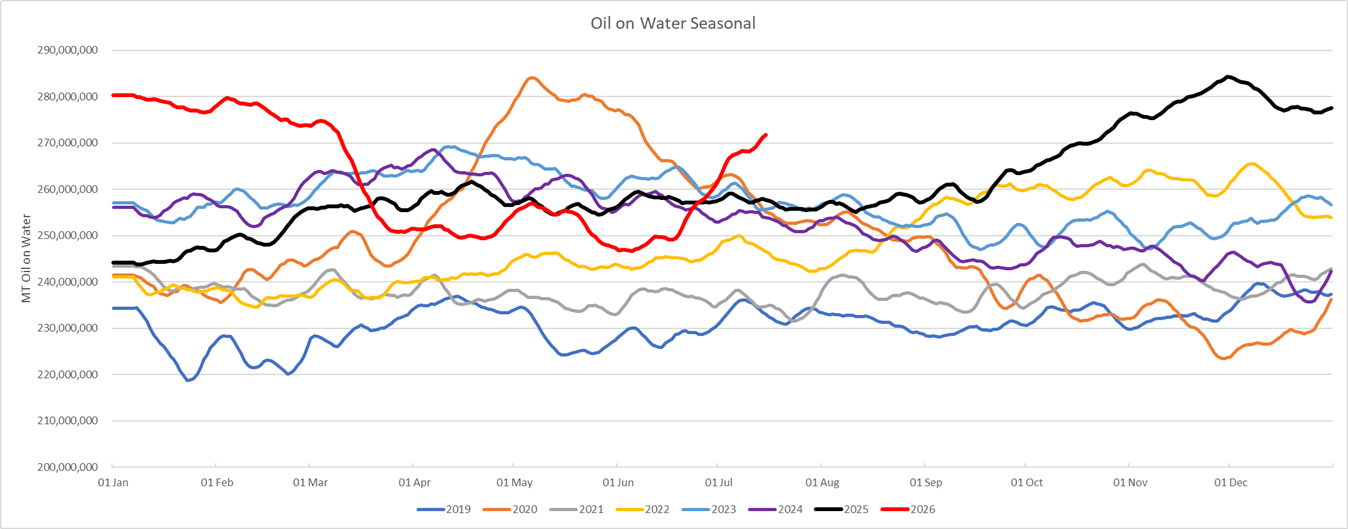
Chart 9
Crude on water built up at the end of 2025 as sanctions restricted unloads from dark fleet vessels. The attacks on Iran and loosening of sanctions meant that the crude on water dropped significantly.